COMPANY
INSIGHT
Sponsored by

Data-driven clinical decision support for differential diagnosis in dementia
Despite recent advances in new biomarkers and improved imaging methods, diagnosis of patients with suspected cognitive disorders remains challenging.
As part of the diagnostic workup, patients typically undergo cognitive testing, basic laboratory testing and brain magnetic resonance imaging (MRI). Additional testing is often performed depending on the suspected cause of symptoms, such as biomarkers from cerebrospinal fluid (CSF), positron emission tomography (PET) imaging or comprehensive neuropsychological assessment.
It goes without saying that reviewing all this multisource data, and mentally picturing whether single tests or combination of tests points to a certain diagnosis, is a daunting task. It is further complicated by the fact that there are multiple possible diagnoses and other reasons (or diseases) that may cause the symptoms of the patient. The relative importance of single tests or biomarkers depends on which diagnosis is being considered. The interpretation of test results depends also on background factors, such as the patient’s age. Finally, economic constraints may define which tests are available and afforded.
To help overcome the difficulties in dementia diagnosis, Combinostics has developed cNeuro®, a cloud-based software tool with the modules cMRI for advanced image analytics and cDSI for data-driven clinical decision support.
Quantitative evaluation of MRI brain images
cNeuro® cMRI provides fully automated quantification of MRI T1 and FLAIR images. Based on T1 brain images, cMRI computes volumes of 102 cortical parcellations and 31 subcortical structures. Extracted volumes are compared to a normative database and percentiles are computed. Based on FLAIR images, cMRI segments white matter hyperintensities (WMH) and results are compared to a normative WMH database.
In addition to the volumes of structures and WMHs, cMRI computes specific dementia related imaging biomarkers. An anterior-posterior index is used to compare atrophy in the anterior versus the posterior parts of the brain and has been shown to be useful for differentiating AD from FTD. Furthermore, cMRI provides computed MTA, GCA (global & lobes) and Fazekas scales. There are several advantages of the computed scales over the visual scoring scales; the computed scales are objective, they use a continuous scale and they are compared to normative data.
All quantitative information is corrected for age, gender and head size. cMRI provides interactive review of images with the ability to toggle segmentation overlays on/off. cMRI generates an “Atrophy and lesion” PDF report including report of longitudinal change.
cNeuro® cMRI is a CE marked and FDA 510(k) cleared product that helps radiologist provide high quality reporting in shorter time.
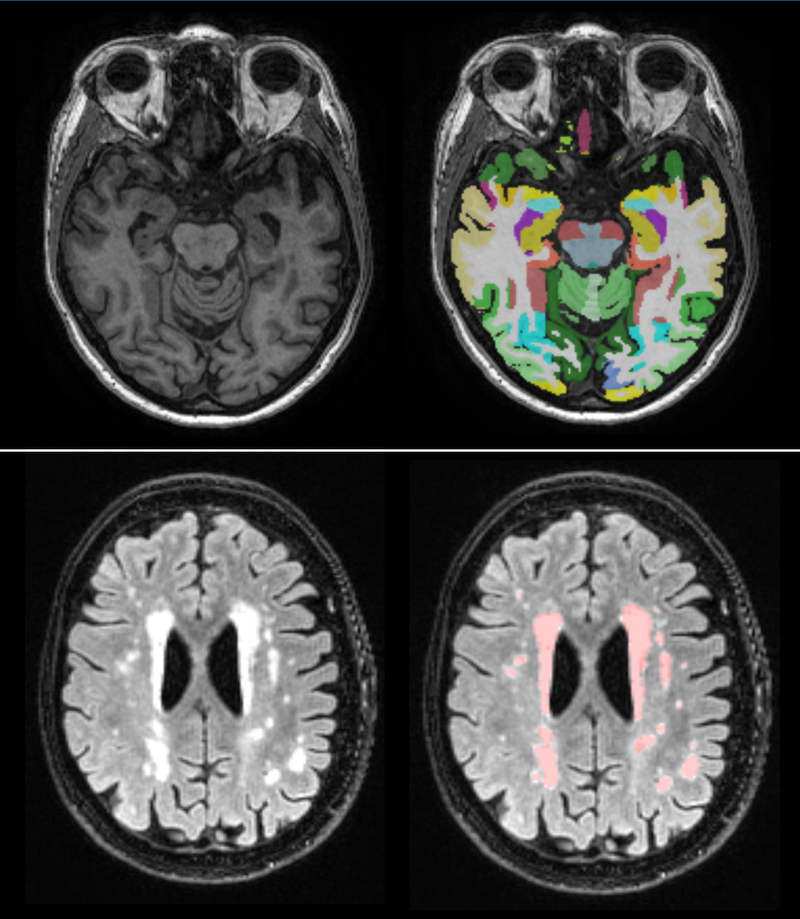
The figure shows structures segmented using T1 images (upper row) and vascular changes identified in FLAIR images (lower row).
Combining all data in a clinical decision support system
cNeuro® cMRI is a product on its own, providing information about how a patient’s images differ from what is expected in an age and gender matched healthy individual. However, for the neurologist, imaging information is just one piece of the puzzle. Furthermore, the neurologist is not primarily interested in whether the patient differs from normal or not, but what the underlying disease is. This is where cDSI comes in.
cDSI is a machine learning system that has been trained with data from a large number of previously diagnosed patients where diagnosis is confirmed through longitudinal follow up. Data sources supported include imaging biomarkers from cMRI, various clinical and neuropsychological tests, as well as CSF biomarkers and APOE status. cDSI compares the data from the patient being evaluated with all previous data, and for each biomarker or test result, a disease state index (DSI) is computed measuring the similarity of the patient to previously diagnosed patients. Results from different tests are then combined in a hierarchical way producing one DSI that represents all data combined. cDSI provides two decision models, etiology and progression. The etiology model presents information about which underlying etiology is the most likely. Supported etiologies include AD, FTD, VaD and cognitive normal (CN). The progression model compares the patient’s data to data from sMCI and pMCI and provides information about similarity of an MCI patient to one of these two groups.
A graphical tree structure, called the disease state fingerprint (DSF) visualizes how each test or biomarker contributes to the overall DSI result. This allows the clinician to, with one glance, see how different test results or groups of test results affect the patient’s similarity to a certain disease. This transparency of the system is critical for acceptance of these types of tools in clinical routine.
In summary cNeuro® cDSI is a CE marked tool intended for the diagnosing clinician and it helps clinical decision making by providing an explicit comparison of the patient’s data to data from previous patients, both on the single biomarker level, on an intermediate level and on a level with all data combined.
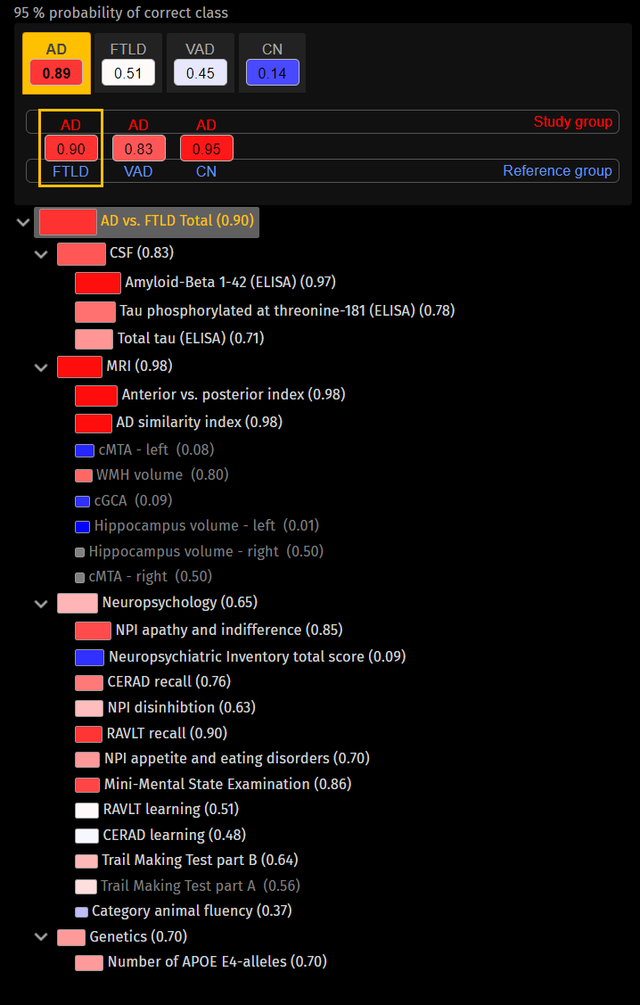
The etiology decision model has been selected and the system indicates that the patient’s data is mostly similar to data from previous patients with Alzheimer disease diagnosis (upper part). The user can review how all data contribute to this suggestion in the Disease State Fingerprint which has been selected to compare Alzheimer’s disease (red) versus frontotemporal dementia (blue).
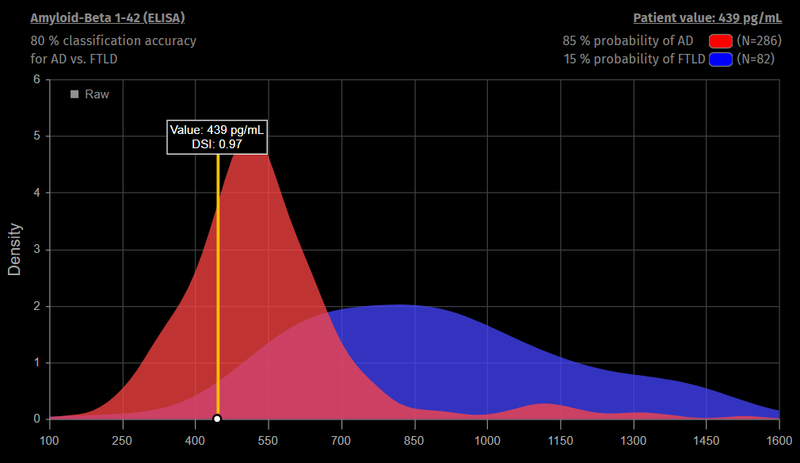
The user can inspect individual biomarker or test results. In this case Aβ42 in CSF has been selected and the figure shows distributions of the Aβ42 CSF biomarker in previous patients diagnosed with Alzheimer disease (red) and frontotemporal dementia (blue). The value measured for the current patient is indicated by the yellow line.